Don't just watch it.
Start your free trial.
Start your free trial.
Your terminal
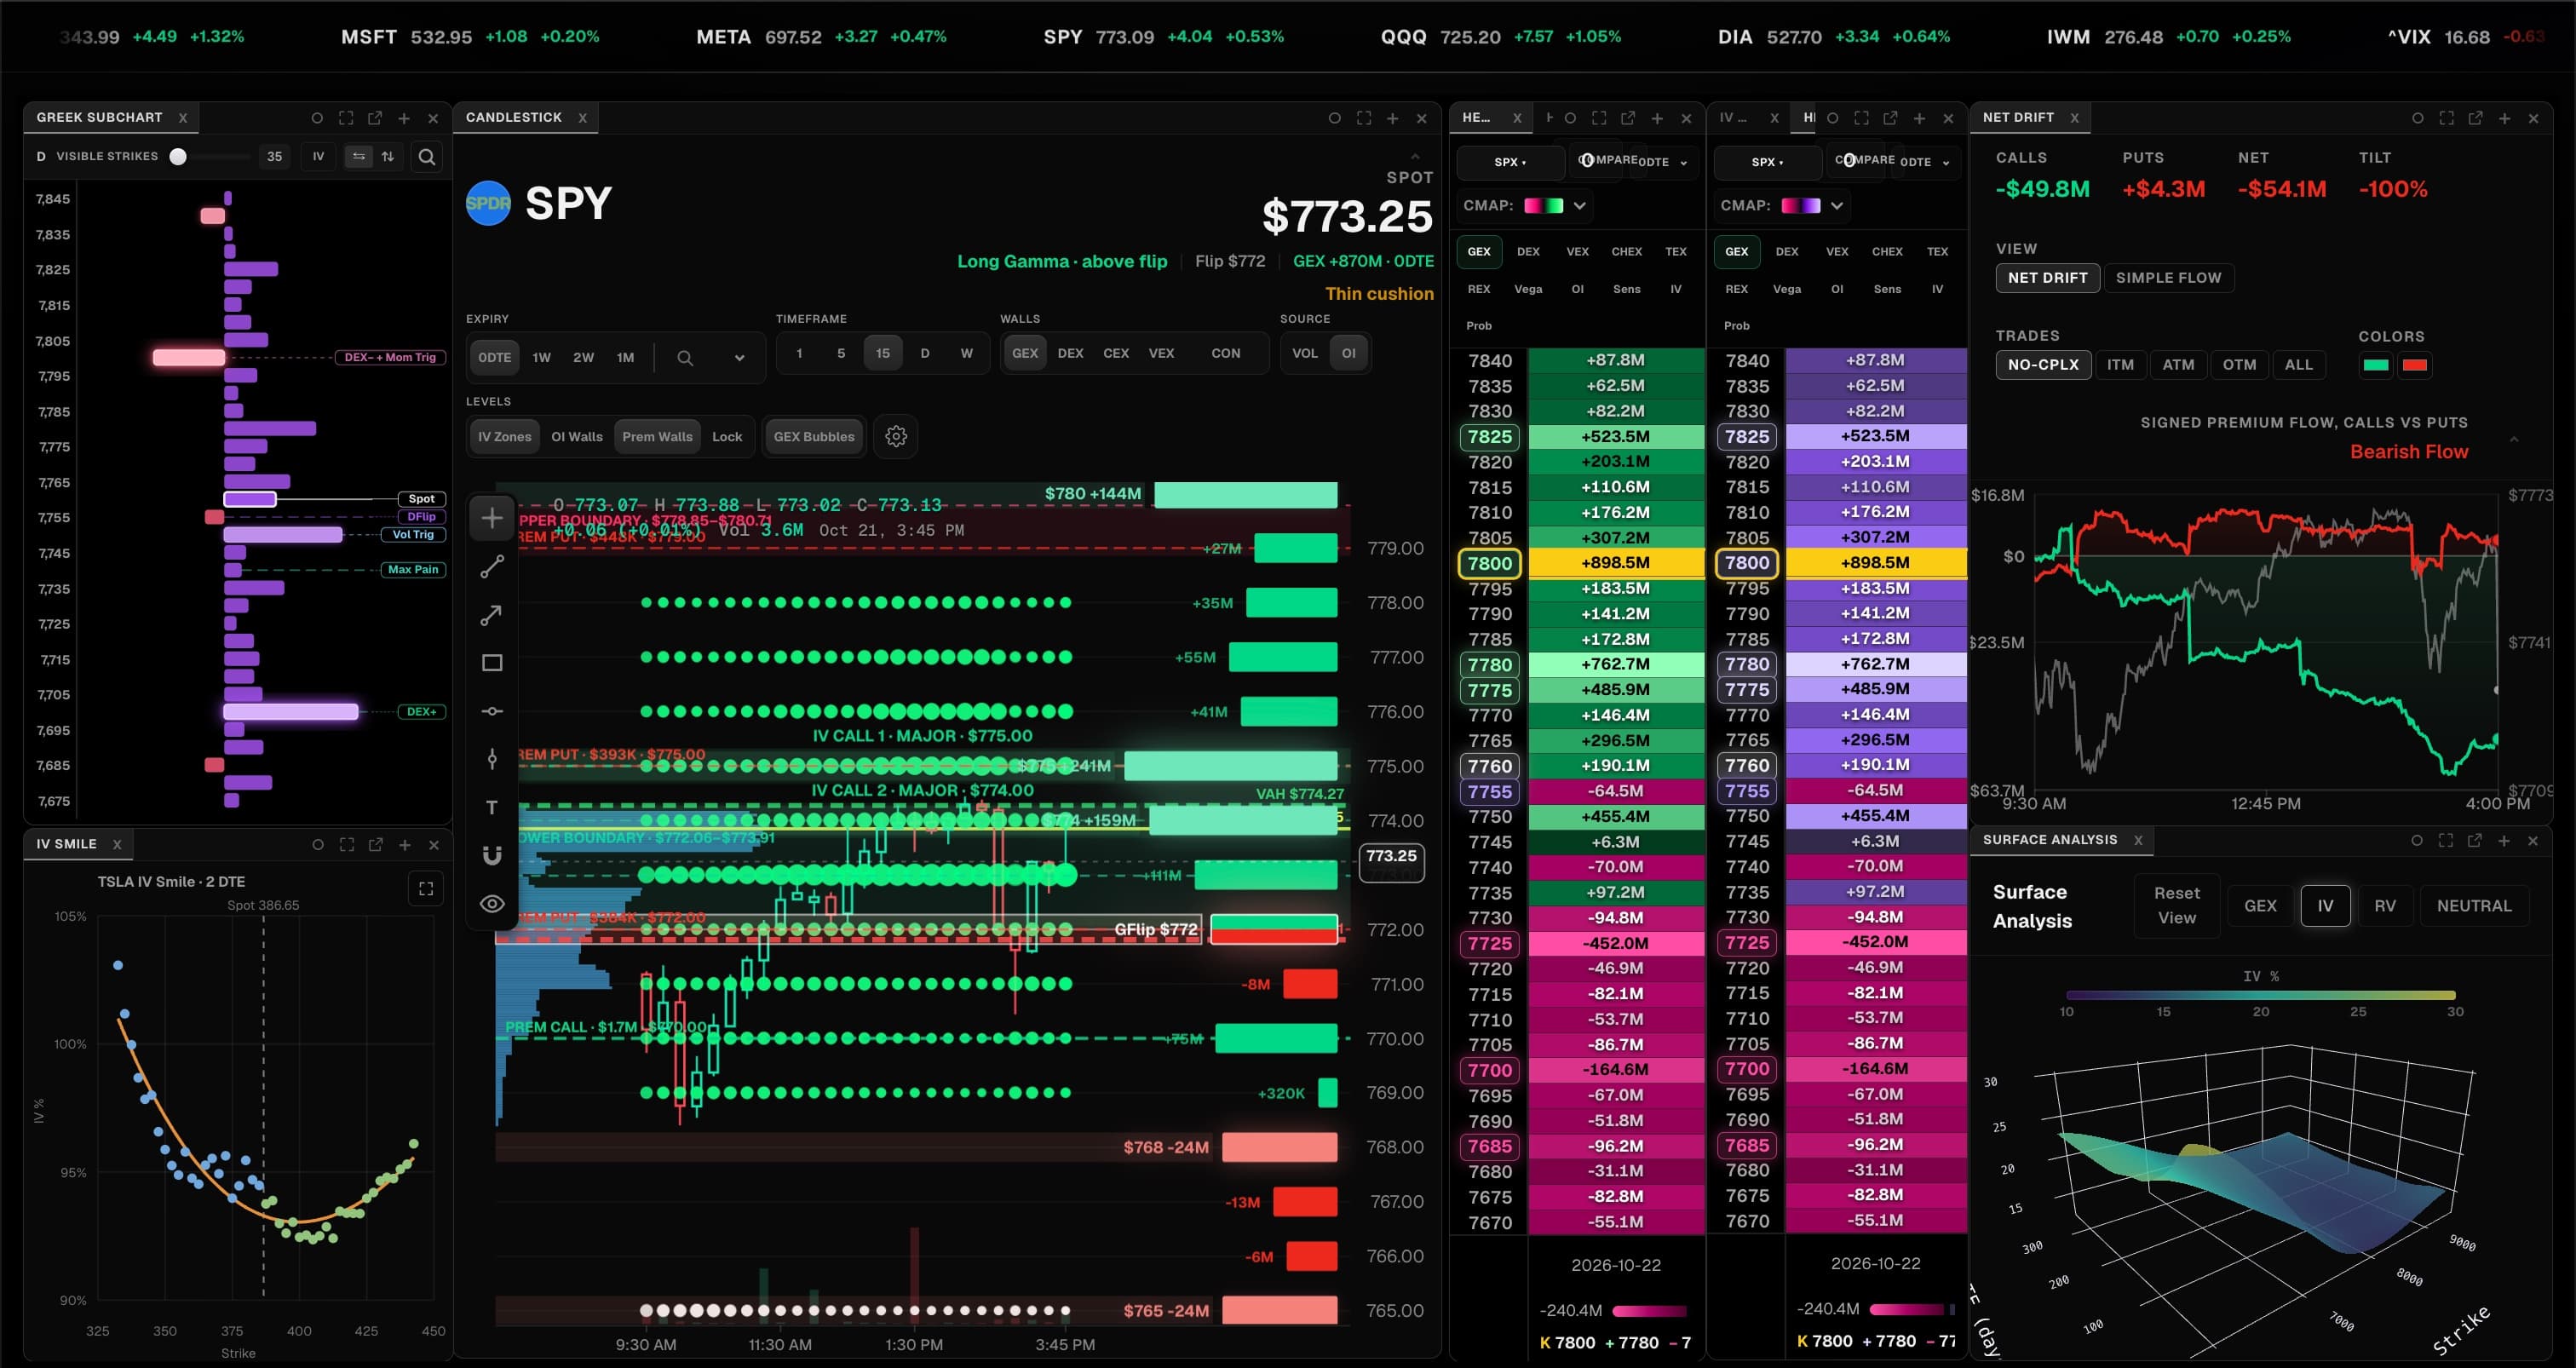
Spot, key levels, exposure and macro on one board, with widgets you toggle on or off, for any of 4,200+ tickers. Try it free for a day.
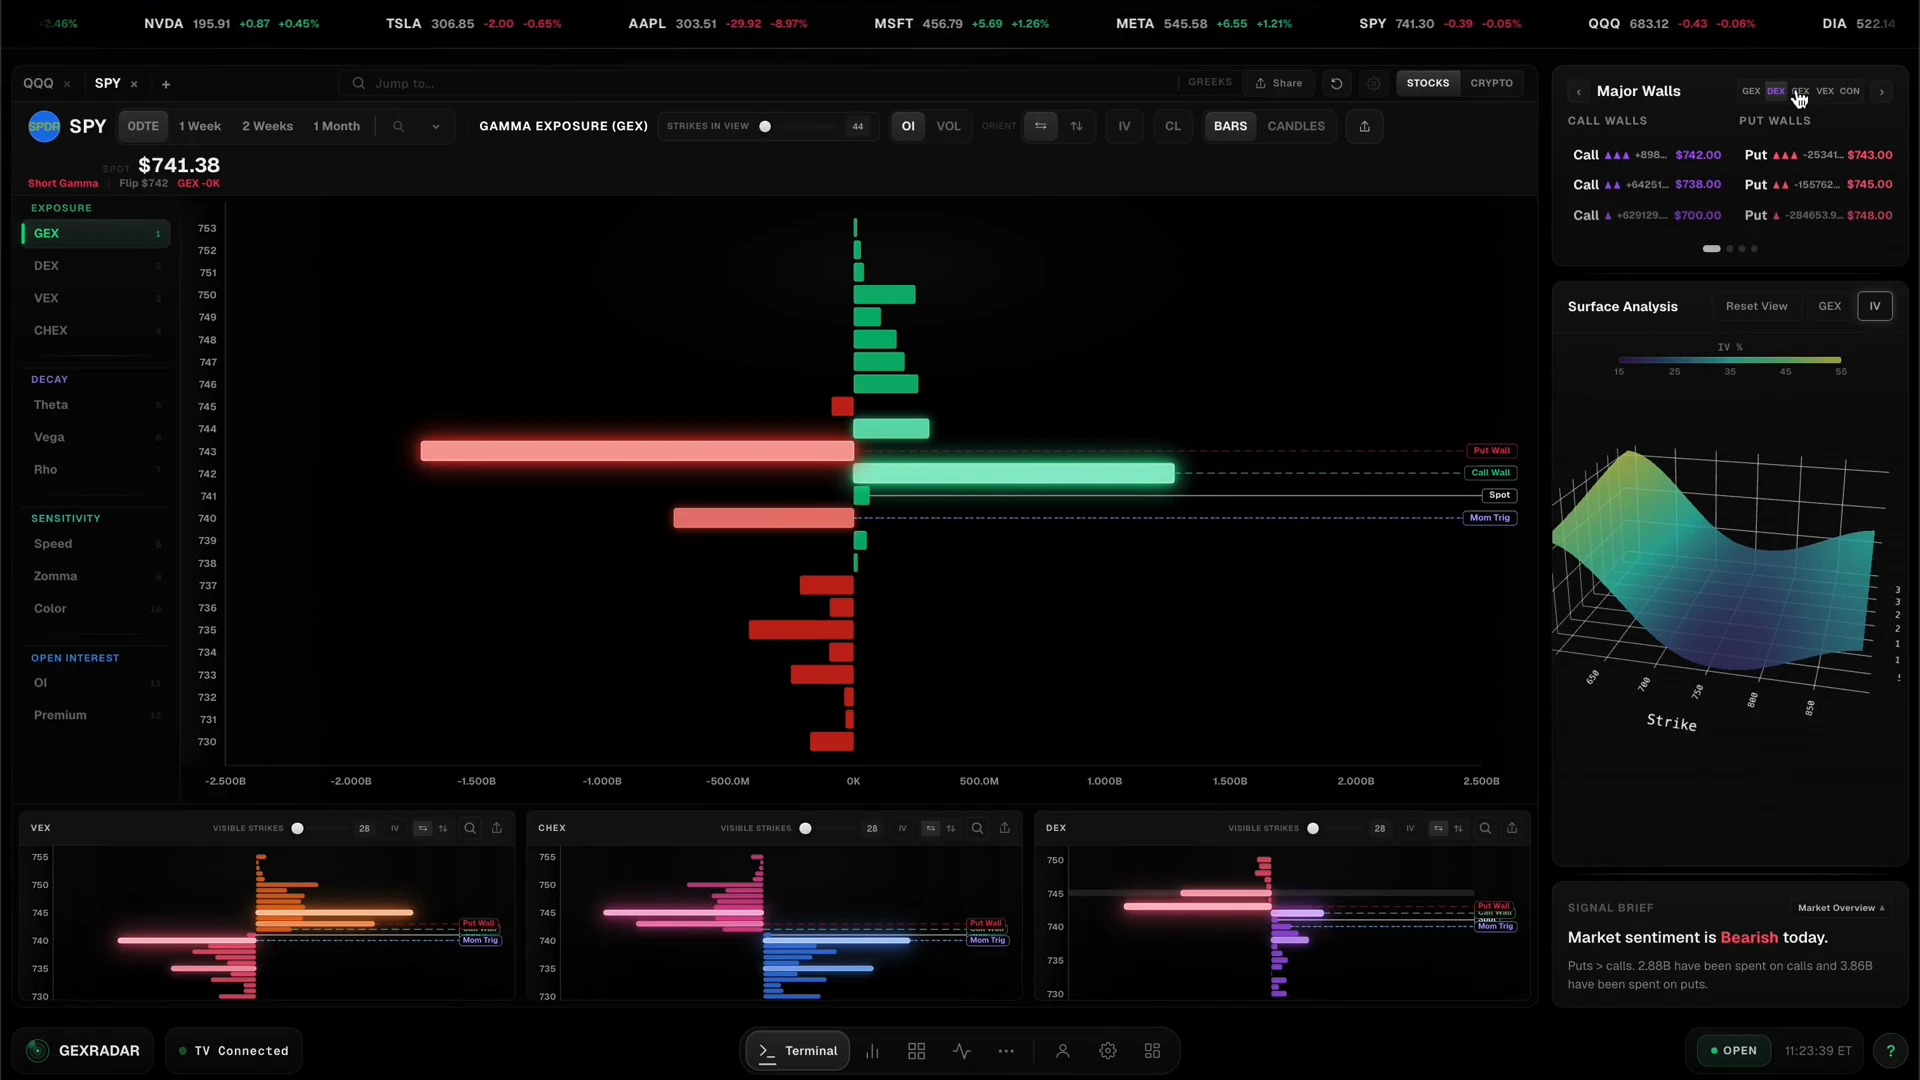
Gamma levels and unusual flow show where the big positions sit. DOM, heatmap and footprint show when the orders hit. All in one terminal you can trade from.
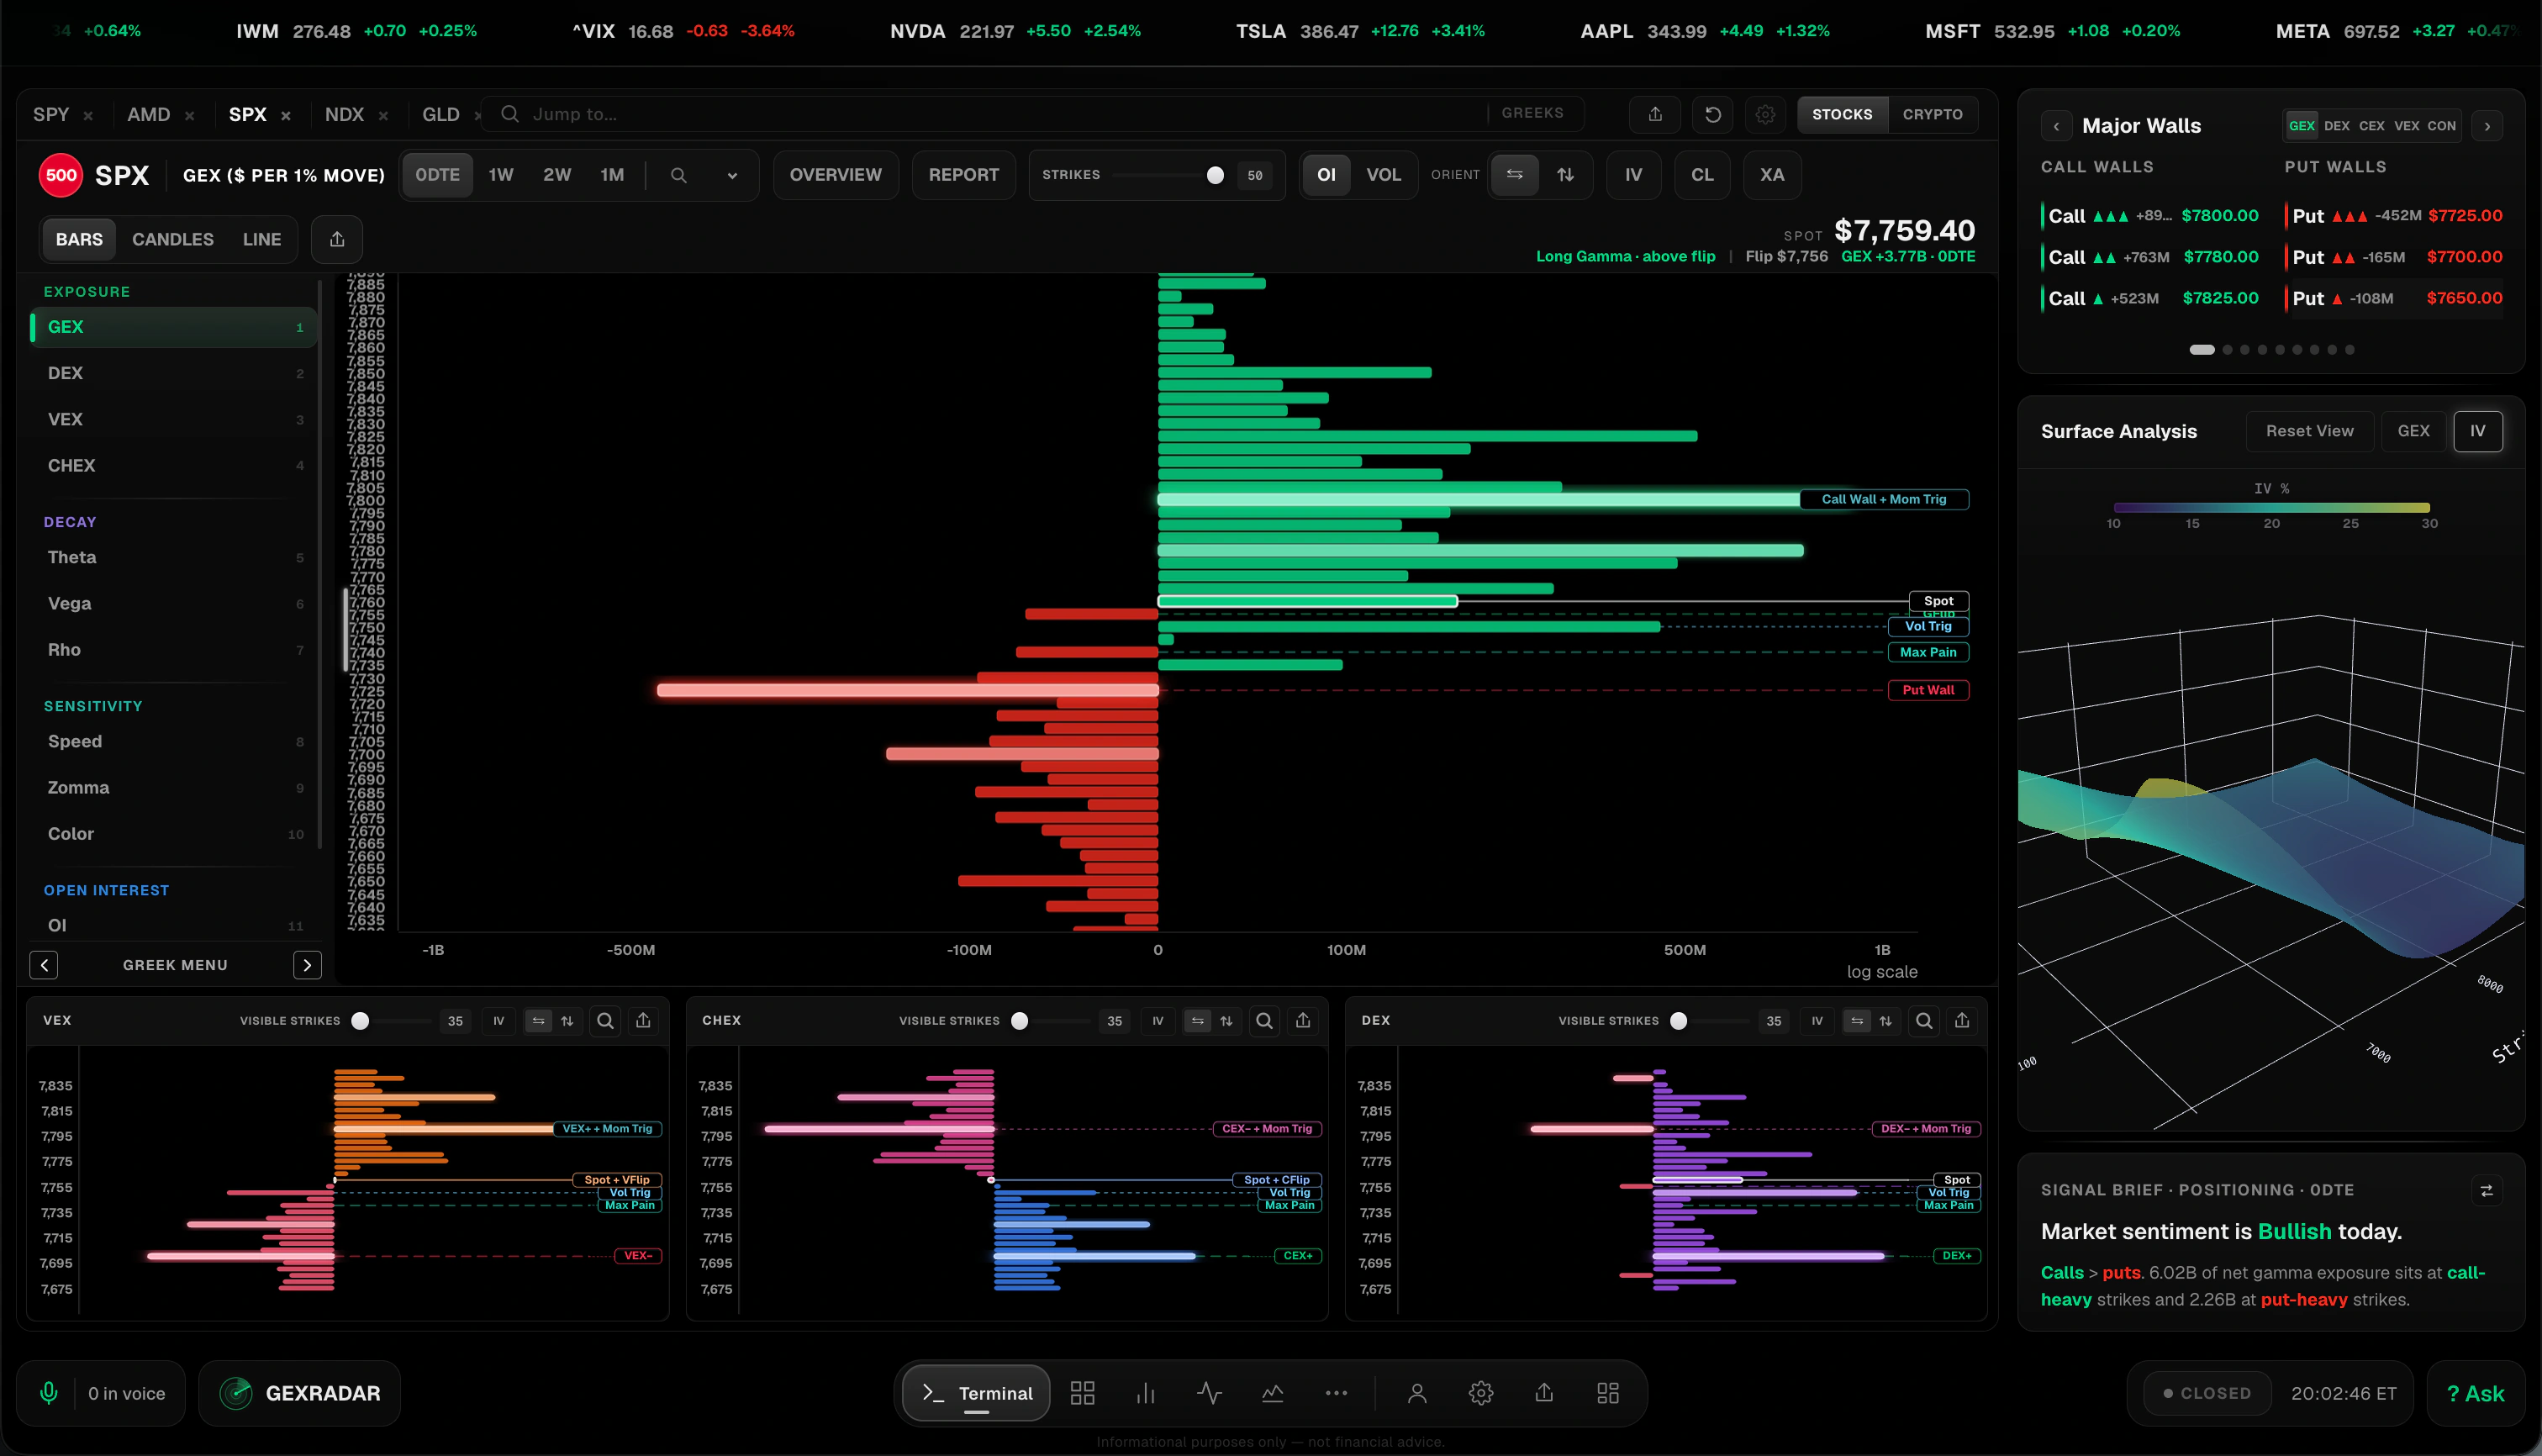
4,200+ tickers.
One structural language.
Futures, options, stocks, ETFs, indices, commodities and crypto (beta), all in the same interface.

 DataFirst
Levels, exposure and flow, computed in real time
Out to
Indicators








Indicators
IncludedAdd-onAdd-onAdd-onAdd-onAdd-onAdd-onAdd-onAdd-onSoonData first. Every order on the book, every print on the tape, and every options position behind the level.
Spot, key levels, exposure and macro on one board, with widgets you toggle on or off, for any of 4,200+ tickers. Try it free for a day.
Options flow shows where the levels are. Order flow shows who is trading them. Options flow is live today; order flow is in development.
Full Greeks and dealer exposures, with gamma, delta, vanna and charm by strike and an automatic 3D exposure view.
Read the volatility skew and term structure across strikes and expiries on a gridded 3D surface.
Signed call and put premium since the open against price, so you see which side is paying up and when the net flips.
See where gamma concentrates across strikes and expiries, so stacked walls stand out at a glance.
High-premium prints scored by Vol/OI, streaming as they hit the tape, minus the options noise.
Call wall, put wall and gamma flip drawn where price actually reacts, recalculated live.
Fed odds, real yields, VIX term structure, sector rotation and a live headline feed in one board.
Rewind every session since October 2023 for the core symbols and watch the structure form bar by bar, exactly as traders saw it.
Where the big positions sit, and the levels they create.
Full Greeks and dealer exposures, with gamma, delta, vanna and charm by strike and an automatic 3D exposure view.
Read the volatility skew and term structure across strikes and expiries on a gridded 3D surface.
Signed call and put premium since the open against price, so you see which side is paying up and when the net flips.
See where gamma concentrates across strikes and expiries, so stacked walls stand out at a glance.
High-premium prints scored by Vol/OI, streaming as they hit the tape, minus the options noise.
Call wall, put wall and gamma flip drawn where price actually reacts, recalculated live.
Fed odds, real yields, VIX term structure, sector rotation and a live headline feed in one board.
Rewind every session since October 2023 for the core symbols and watch the structure form bar by bar, exactly as traders saw it.
A true order flow platform, not just a data viewer: see who is trading at those levels, then trade them right on the platform from your own accounts.
Request accessSee resting liquidity build and pull at each price, and follow the trades that hit it.
A clean price ladder with bid and ask depth, so large resting orders and absorption stand out. Trade it from your own accounts without leaving the platform.
Bid and ask volume inside every bar, with imbalances, delta and the point of control marked.
Volume traded at every price, with the point of control and value area marked for the session.
Every 15-minute period adds a square at each price it traded, coloured by period, building the session profile with POC and value area.
Large prints drawn as bubbles on price, sized by contracts, so size stands out from the noise.
The live tape, filtered and color-coded, with large prints highlighted as they hit.
A true order flow platform, not just a data viewer: see who is trading at those levels, then trade them right on the platform from your own accounts.
See resting liquidity build and pull at each price, and follow the trades that hit it.
A clean price ladder with bid and ask depth, so large resting orders and absorption stand out. Trade it from your own accounts without leaving the platform.
Bid and ask volume inside every bar, with imbalances, delta and the point of control marked.
Volume traded at every price, with the point of control and value area marked for the session.
Every 15-minute period adds a square at each price it traded, coloured by period, building the session profile with POC and value area.
Large prints drawn as bubbles on price, sized by contracts, so size stands out from the noise.
The live tape, filtered and color-coded, with large prints highlighted as they hit.
Your terminal, built your way. Arrange every panel exactly how you trade.
Your GEX levels, on every chart. Walls, flip and trigger levels painted onto your charting platform. Auto-updating, no ticker entry, futures auto-converted.
The options flow API. Every US option, every second, one API. Dealer gamma, key levels, Greeks exposure, flow, tape and sweeps, computed from the live OPRA book and ready for your code and your AI assistant.
curl -H "Authorization: Bearer $DATAFIRST_KEY" \
https://api.datafirsttrading.com/v1/symbols/SPY/levels● 200 OK{"data": { "key_levels": {"gamma_flip": 766.51, "call_wall": 770.0, "put_wall": 760.0, "max_pain": 770.0}, "totals": {"net_gex": -2511916135, "gex_ratio": 0.3869}}, "meta": {"symbol": "SPY", "as_of": "2026-10-19T20:33:28.174Z", "spot": {"price": 766.92}}}Give your coding agent a DataFirst key and ask in plain English. It reads the docs, writes the request, pulls the levels or the flow into your project and builds the chart, alert or backtest you described. You can also choose GLM, Kimi or DeepSeek in a compatible coding agent.
Rather write it yourself? It's plain JSON over HTTPS with one bearer key, so any language or notebook works.
 Codex
 ChatGPT
 Grok
 Gemini CLI
 GLM
 Kimi
> pull SPY gamma levels for the last 5 sessions and chart them against the close
●I'll use the DataFirst MCP server to pull SPY's levels for each session.
●datafirst · history_levels("SPY", sessions=5)
└ 5 sessions of call wall, put wall and gamma flip
●Bash(python plot_levels.py)
└ wrote spy_levels.csv, spy_levels.png
●Done. The chart shows each close against that day's call wall, put wall and gamma flip.
Every endpoint is also an MCP tool, in Claude, Cursor and any MCP client. Example session.
Trade beside a mentor live every day, get your journal reviewed, and leave with a model you can run on your own. The entire DataFirst terminal comes with it.
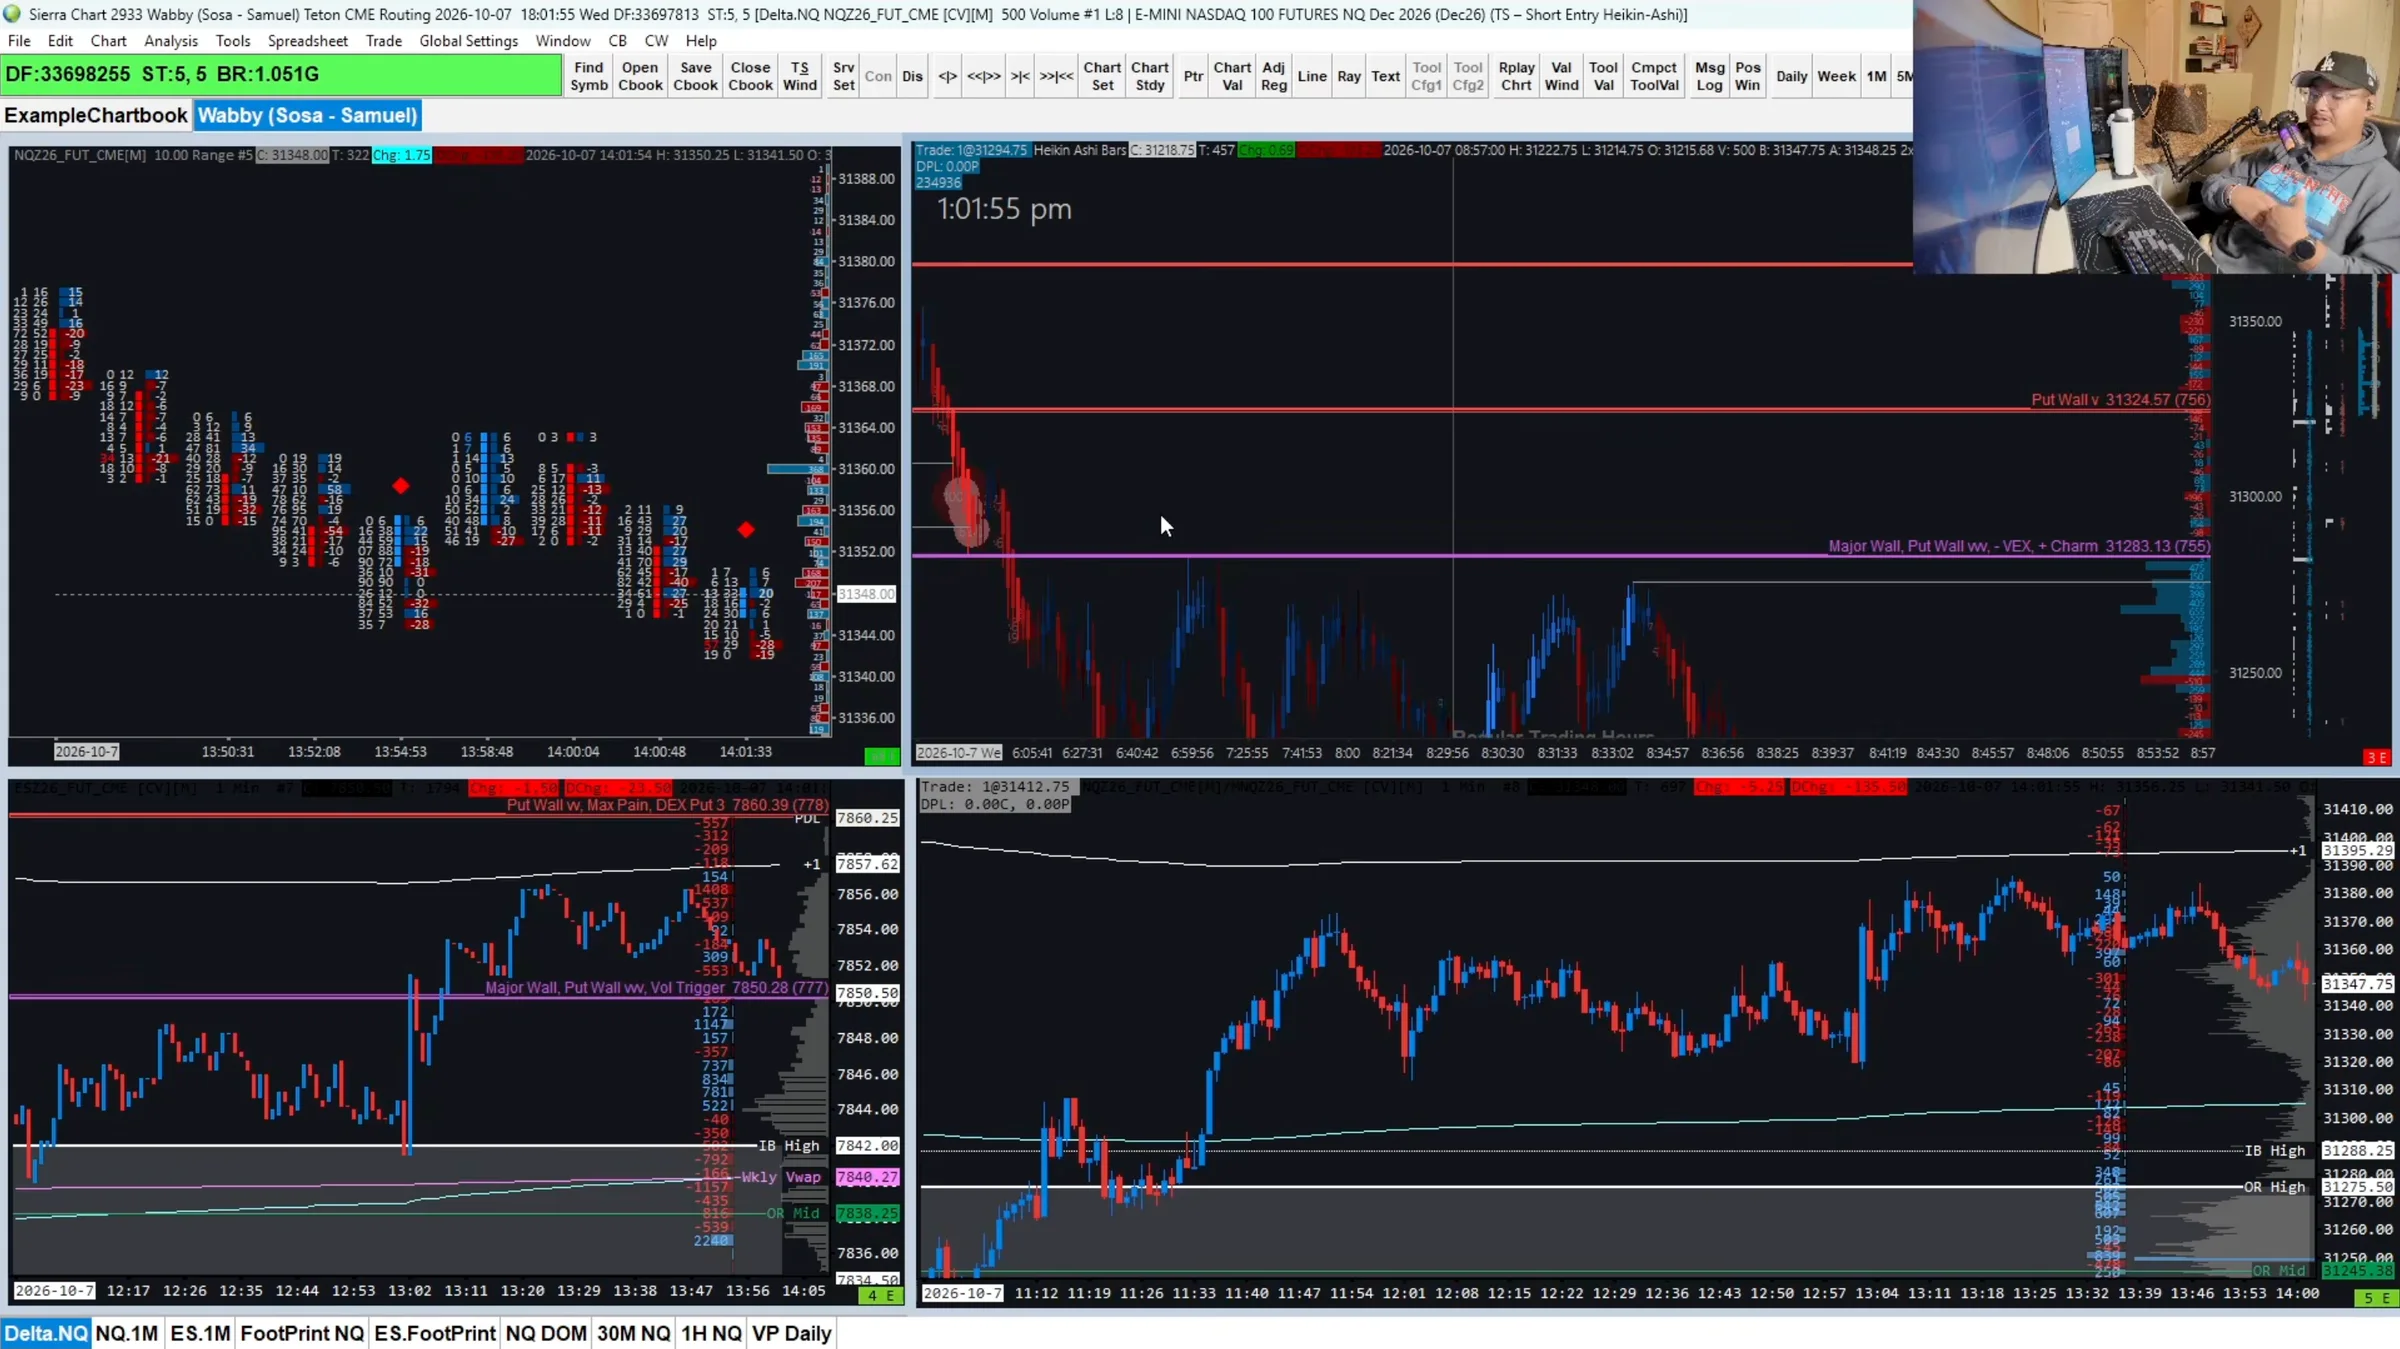
Trade alongside us live every market day: the entries, the exits, and the reasoning behind them, not a green screenshot after the fact.
Not a forum where you post and hope. Your trades get looked at daily, so the same mistake gets caught in week one instead of month six.
Individual time, not a seat in a room of 400. Academy members get 2 a week; Lifetime members book as many as they need. This is why enrollment is capped.
We help you build a repeatable framework around options flow and order flow. Yours, not a copy of someone else's setups you can't run without them.
Every plan: the entire DataFirst terminal, daily live trading, daily journal reviews and recaps, weekly live stages, the options flow library and risk training.
Educational only, never financial advice.
Full access to every feature. Optional 1-day free trial, then subscribe monthly or save with annual.
Most popular · save 25%
$37.50$49.99per month
+ $2.50/mo data fee ($30.00/yr)
Billed $449.99/yr · save $149.89 (25% off)
3 free calls / month with the team
Start free trialOptional 1-day free trial: $0 today, billed after 24h unless you cancel.
The platform, the price and the spelling, in three answers.
One-on-one with the team: a walkthrough of the terminal, how to read the walls and the flow, and answers for your own setup.